Quick Answer
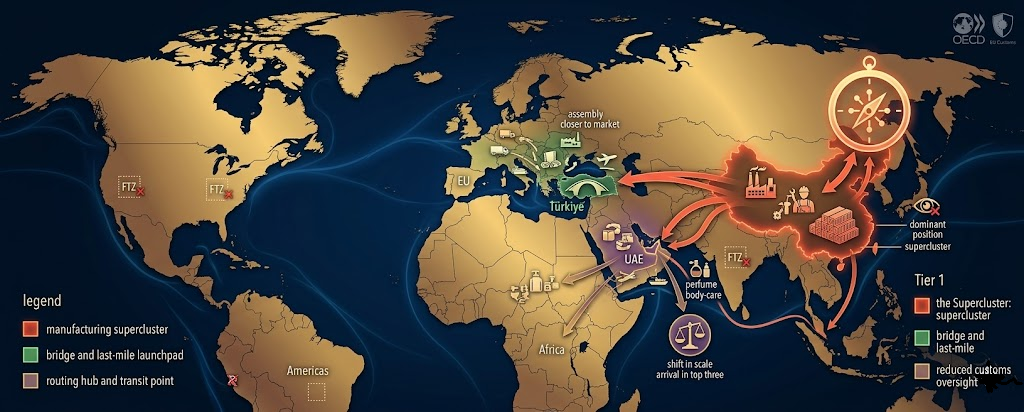
A country-by-country map of where counterfeit goods come from, how they move, and why product-level authentication matters.
Back to Blog
GEOGRAPHY
13 min read
The World Map of Fakes: Where Counterfeit Products Actually Come From
A country-by-country map of where counterfeit goods come from, how they move, and why product-level authentication matters.
The World Map of Fakes: Where Counterfeit Products Actually Come From
Geography
A country-by-country map of where counterfeit goods come from, how they move, and why product-level authentication matters.
QUICK ANSWER
A country-by-country map of where counterfeit goods come from, how they move, and why product-level authentication matters.
Introduction: A $467 Billion Global Crime Has a Geography
Counterfeit trade is global in scale, but it is not global in origin. Behind almost every fake bar of Dubai chocolate, every doctored tub of whey protein, every vial of bogus Botox, every fake Cartier earring intercepted at the U.S. border, there is a small, predictable set of countries doing the manufacturing and another small, predictable set doing the moving.
According to the joint OECD–EUIPO Mapping Global Trade in Fakes 2025 report, the world traded approximately USD 467 billion in counterfeit goods in 2021, equal to about 2.3% of total global imports, and 4.7% of all EU imports. Industry projections (Corsearch / Frontier Economics) place that figure on track to hit USD 1.79 trillion by 2030, with associated displaced legitimate economic activity already at roughly $1.1 trillion in 2022 alone, costing 4.2–5.4 million jobs worldwide.
This article unfolds that data as a world map country by country, customs data by customs data to show where the fakes are actually being made, where they pass through, and where they end up. The picture is clear, evidence-based, and surprisingly concentrated.
Tier 1 The Supercluster: China and Hong Kong (China)
If counterfeit trade had a capital city, it would have a Chinese postcode.
The combined position of China and Hong Kong is so dominant that almost every major customs authority in the world reports the same finding:
There are three structural reasons for this concentration. First, China’s enormous legitimate manufacturing base the same factories that make many of the world’s authentic clothes, electronics, and packaging also has the capacity, raw materials, and skilled labour to produce convincing fakes. Second, Hong Kong’s role as a free-port logistics hub makes it the world’s most effective re-export channel: a counterfeit can be manufactured in mainland China, routed through Hong Kong, and re-exported with paperwork that obscures its true origin. Third, free-trade zones across the region operate with reduced customs oversight, which the OECD has repeatedly identified as a structural enabler of counterfeit movement.
OECD–EUIPO (global, 2021): China remains the primary source of counterfeit goods globally, accounting for approximately 45% of all reported seizures in 2021. When goods routed through Hong Kong are added, that share rises to roughly 62% of all counterfeit items seized in global trade.
U.S. Customs and Border Protection, Fiscal Year 2024: China and Hong Kong are consistently the top two source countries for U.S. Intellectual Property Rights (IPR) seizures, and in FY 2024 they jointly accounted for approximately 90% of the total quantity seized. CBP alone seized nearly $5 billion worth of counterfeit luxury, fashion, and footwear in 2024, with the FY 2024 manufacturer-suggested retail price of seized IPR-violating goods up 95% versus FY 2023.
EU Customs, 2023: China was the country of origin for over 56% of all counterfeit items detained at the EU border, followed by Hong Kong with almost 9%.
EU Customs, 2024: China still led with about 42% of EU border detentions, with Türkiye at 18% and the UAE entering the top three for the first time at 5.5%.
United Kingdom (OECD Trade Policy Paper No. 287, 2024): China, Türkiye, and Hong Kong together accounted for 75.8% of UK seizures and 89.8% of seized value of IP-infringing imports.
Tier 2 The Pivot: Türkiye
If China and Hong Kong are the world’s counterfeit factory floor, Türkiye is its bridge.
Türkiye’s geographic position straddling Asia and Europe, with sophisticated textile, leather, and cosmetics industries and direct road, sea, and air links to the EU makes it the most efficient “last-mile” launchpad for counterfeit goods being smuggled into Europe. Counterfeiters increasingly favour what the OECD calls “localisation” strategies: shipping unassembled components or unfinished products to a country closer to the destination market, then completing assembly or labelling there. Türkiye is the textbook example.
EU Customs, 2024: Türkiye accounted for about 18% of all counterfeit goods detained at the EU border its highest share on record and a sharp rise from its 8% share in 2023.
EU Customs, 2023: Türkiye was the third-largest country of provenance for counterfeit goods entering the EU, with over 8% of detentions.
UK (OECD, 2024): Türkiye is one of the top three exporters of UK IP-infringing goods, alongside China and Hong Kong.
OECD–EUIPO sectoral data: Türkiye is repeatedly identified among the top provenance economies for counterfeit perfumery and cosmetics, alongside China, Hong Kong, the UAE, and India.
Tier 3 The New Entrant: United Arab Emirates
The most striking finding in the 2024 EU customs data is the arrival of the United Arab Emirates in the top three countries of origin for counterfeit goods entering Europe 5.5% of EU border detentions in 2024, primarily for body-care and cosmetic products.
The UAE’s appearance is not new in the broader data earlier OECD–EUIPO sectoral studies (2017–19) already identified the UAE among the top provenance economies for counterfeit perfumery, cosmetics, watches, and leather goods. What changed in 2024 was scale. EU enforcement authorities now flag this as a “possible shift in the global supply chain,” driven by:
The UAE is not principally a counterfeit manufacturing economy. It is a counterfeit routing economy a high-volume transit point where goods from East Asia are repackaged, relabelled, and dispatched to Europe, Africa, and the Americas. The 2024 data suggests this routing function is rapidly becoming systemic.
Dubai’s role as one of the world’s largest re-export hubs.
Free-trade-zone density across the Gulf, which limits inspection of goods in transit.
The UAE’s deep connectivity with both Chinese and Turkish supply chains.
Tier 4 The Domestic Giant: India
India occupies a unique position on the counterfeit world map. It is a major exporter of fake goods repeatedly identified by the OECD–EUIPO as a top-ten provenance economy and a growing source of counterfeit perfumery and cosmetics. But its largest impact is internal, and the scale is staggering.
According to the FICCI–CASCADE 2022–23 report, the total illicit market across just five Indian sectors packaged FMCG, personal and household care, alcohol, tobacco, and textiles & apparel was estimated at approximately ₹7,97,726 crore (over USD 96 billion).
Other data points:
A 2026 raid by the Delhi Crime Branch on a single counterfeit-supplement unit in the National Capital Region seized roughly 100 kg of fake Optimum Nutrition, BSN Syntha-6, and Isopure protein supplements plus 55 kg of raw materials a small but representative snapshot of the manufacturing infrastructure that supports the figures above.
The Authentication Solution Providers’ Association (ASPA) estimated counterfeiting losses to the Indian economy at roughly ₹1 trillion (over $12 billion) per year, with fake goods causing approximately $16.2 billion in annual tax-revenue loss.
State of Counterfeiting in India 2025 (ASPA/Crisil) found that 89% of urban Indian consumers have purchased a counterfeit product at least once, and consumers estimated that roughly 29% of products in their local markets were counterfeit in 2025.
Sectoral breakdown: counterfeit penetration is approximately 34% in apparel, 31% in consumer electronics, 28% in FMCG, and 22% in automotive parts.
Pharmaceuticals: counterfeit drugs are estimated to account for 10–12% of the Indian pharmaceutical market, with the worst impact in antibiotics, antimalarials, and lifestyle medications a public-health threat as well as an economic one.
FICCI–CASCADE 2024: the counterfeit FMCG-packaged-food market is growing at roughly 15% per year, faster than the legitimate FMCG market.
FSSAI (2019): of 94,288 processed-food samples tested, 26,077 were found to be adulterated or misbranded over 27%.
Tier 5 Secondary Clusters: Southeast Asia, Latin America, North Africa
Beyond the top four, OECD–EUIPO data identifies a consistent secondary tier of provenance economies whose role is growing:
Singapore, Malaysia, Thailand, and Vietnam function as both transit hubs and increasingly as production economies, particularly for counterfeit electronics, cigarettes, and luxury goods.
Mexico appears repeatedly in the top ten provenance economies for counterfeit goods seized between 2014 and 2016, particularly for goods bound for the U.S. market.
Morocco has been singled out by the OECD as a “rising” source of fakes destined for the EU, primarily for textiles and leather goods.
North Macedonia (referred to in earlier reports as FYR Macedonia) and the Western Balkans function as overland transit routes Serbia destroyed approximately 230,000 counterfeit items in 2024 alone, and Albania has been documented as a transit corridor for counterfeit goods entering the EU.
Iran appears in regional cosmetics-counterfeit data, particularly as an indirect supplier into Gulf re-export markets, though it does not appear in EU/US top-ten provenance lists in OECD–EUIPO reports.
Where the Fakes Go: The Destination Map
Origin is only half the picture. Customs data reveals an equally concentrated geography of destinations.
European Union (overall): The EU is the world’s single largest target of counterfeit imports. In 2023, EU enforcement authorities detained roughly 152 million counterfeit articles worth approximately €3.4 billion a 77% jump from 2022. In 2024, EU authorities detained 112 million items worth a record €3.8 billion (the highest value ever recorded). Customs seizures at the EU’s external borders alone hit a ten-year peak in 2024.
Italy is by far the EU’s most affected member state 74% of all items detained in 2023 and roughly 58% of detained value. In 2024, two out of every three counterfeit items seized in the EU were intercepted by Italian authorities.
The Netherlands, Spain, France, Germany, Portugal, Romania, Poland, and Greece together accounted for the overwhelming majority of remaining EU seizures.
United States: CBP seized nearly $5 billion worth of counterfeit goods in FY 2024, with seizures from China and Hong Kong representing roughly 90% of total quantity. The top three product categories by MSRP for the past three years have been jewelry, watches, and handbags/wallets.
United Kingdom: The OECD’s 2024 trade paper estimated the value of imported goods infringing UK IP rights at approximately £12.1 billion, with associated losses of about 1.4% of legitimate sales, 20,000 jobs, and £776 million in public revenue.
How the Fakes Travel: The Quiet Revolution in Small Parcels
The single most important change in counterfeit logistics over the past decade is the shift from container shipping to small parcels.
This shift is the direct product of cross-border e-commerce. Every cheap online order is now a potential vector for counterfeit goods, and every postal-network truck is a potential counterfeit-distribution vehicle.
According to U.S. CBP, over 90% of all counterfeit seizures in the U.S. now occur in the international mail and express-courier environments, not in container cargo.
The OECD–EUIPO 2025 report identifies postal services as the primary channel for counterfeit distribution globally, with small parcels classified as “de minimis” trade routinely evading inspection.
The EU’s 2024 report records that postal and express-courier services dominate counterfeit-detention cases by volume, even though sea cargo still moves the largest tonnage.
What the Map Tells Us
When the data is laid out together, four clear patterns emerge:
-
The supply side is concentrated. Just three jurisdictions China, Hong Kong, and Türkiye account for roughly 78–90% of all counterfeit goods seized by EU and U.S. customs, depending on the year and methodology. Add the UAE and India and almost the entire global counterfeit trade has a documented provenance.
-
The mid-tier is shifting. The UAE’s 2024 entry into the EU top three, and India’s growth as both an internal market and a regional exporter, suggest the future of counterfeit geography is multi-polar rather than China-only.
-
The destinations have not changed. The EU and the U.S. remain the two great counterfeit consumer markets of the world, with Italy alone absorbing the majority of EU detentions.
-
The detection problem is now logistical, not industrial. Counterfeiters have moved from shipping containers full of fakes to millions of small parcels a logistical change that defeats most twentieth-century customs inspection models.
A Modern Footnote
The same OECD report that documents this geography also makes a structural point that ties this entire series together. It notes that traditional enforcement border seizures, criminal prosecution, post-incident recalls is overwhelmed by the scale of e-commerce and small-parcel trade. A counterfeit factory in Guangdong can ship 10,000 fake protein tubs, 10,000 fake lipsticks, or 1,000 fake Botox vials in 10,000 individual parcels each below the customs inspection threshold to 10,000 separate consumers in 50 different countries, in under a week.
That is why the global anti-counterfeit conversation has shifted from border enforcement to product-level authentication. From the medieval leopard’s head struck on a silver bowl in 1300 to the cryptographic QR codes being deployed today on individual product units, the underlying logic is the same: bind the identity of a product to its maker, and let any buyer anywhere verify that bond in seconds. Platforms such as TrustQR sit precisely in that lineage modern descendants of an 800-year-old solution to the world’s oldest commercial crime.
The world map of fakes is unlikely to redraw itself soon. But the world map of authentication of which products, in which markets, can actually be verified at the point of sale is being redrawn right now.
Sources & Further Reading
These external references support the article topic and help readers verify the broader research context behind product verification, counterfeit risk, consumer safety, or supply chain protection.
OECD–EUIPO, Mapping Global Trade in Fakes 2025: Global Trends and Enforcement Challenges
OECD, Addressing the persistent and complex challenges of counterfeit trade (full-report component: China 62% share)
OECD press release, “Global trade in fake goods reached USD 467 billion.”
EUIPO, Mapping Global Trade in Fakes 2025
European Commission Taxation & Customs Union, “EU seizes record 152 million fake items worth €3.4 billion in 2023.”
European Commission Taxation & Customs Union, “European Union detains 112 million counterfeit items worth €3.8 billion in 2024.”
EUcrim, “EU Customs Report 2023: €3.4 Billion Worth of Counterfeit Goods Seized.”
Lexology / EU Reports, “EU Reports Highest Value of Counterfeit Goods Ever: EUR 3.8 Billion in 2024.”
EUnews, “€3.8 billion worth of counterfeit goods seized across the EU in 2024.”
U.S. Customs and Border Protection, IPR Seizure Statistics FY 2024
U.S. CBP, “The Truth Behind Counterfeits” (90% from China and Hong Kong)
U.S. CBP, “$25 million in counterfeit jewelry” (FY 2024 China/Hong Kong share)
OECD, Trade Policy Paper No. 287 Trade in counterfeit products and the UK economy
OECD–EUIPO, Global Trade in Fakes: A Worrying Threat (sectoral cosmetics provenance: China, Hong Kong, UAE, Türkiye, India)
ASPA / Crisil, State of Counterfeiting in India 2025; ASPA, State of Counterfeiting in India 2021
BW Businessworld / FICCI-CASCADE 2024 data, “Counterfeit Epidemic: How Fake Products Are Infiltrating India’s Consumer Market.”
ASPA Global / Counterfeiting in India blog, “Counterfeiting in India: A Growing Challenge.”
Corsearch / Frontier Economics, Global Counterfeit Goods Market to Hit $1.79 Trillion by 2030
The Fashion Law, “The Counterfeit Crackdown: Inside the New Border Playbook” (CBP $5 billion FY 2024)
Statista / OECD–EUIPO data, “Global trade volume with counterfeit goods compared to GDP of selected countries.”
Related TrustQR pages
Continue with the QR product verification workflow, review anti-counterfeit platform features, or compare QR code and contactless tag pricing.